In this article I will show the results of my small program in which I have implemented a genetic algorithm to train a deep neural network in the Unity game engine. All this is done in order to optimize the movement pattern of the individuals to achieve the best possible result for the given objectives. The goal may be a straight line movement as well as a high movement, which will allow us to see how the deep neural network behaves under given conditions and what the result will be, and how it can be improved in the future.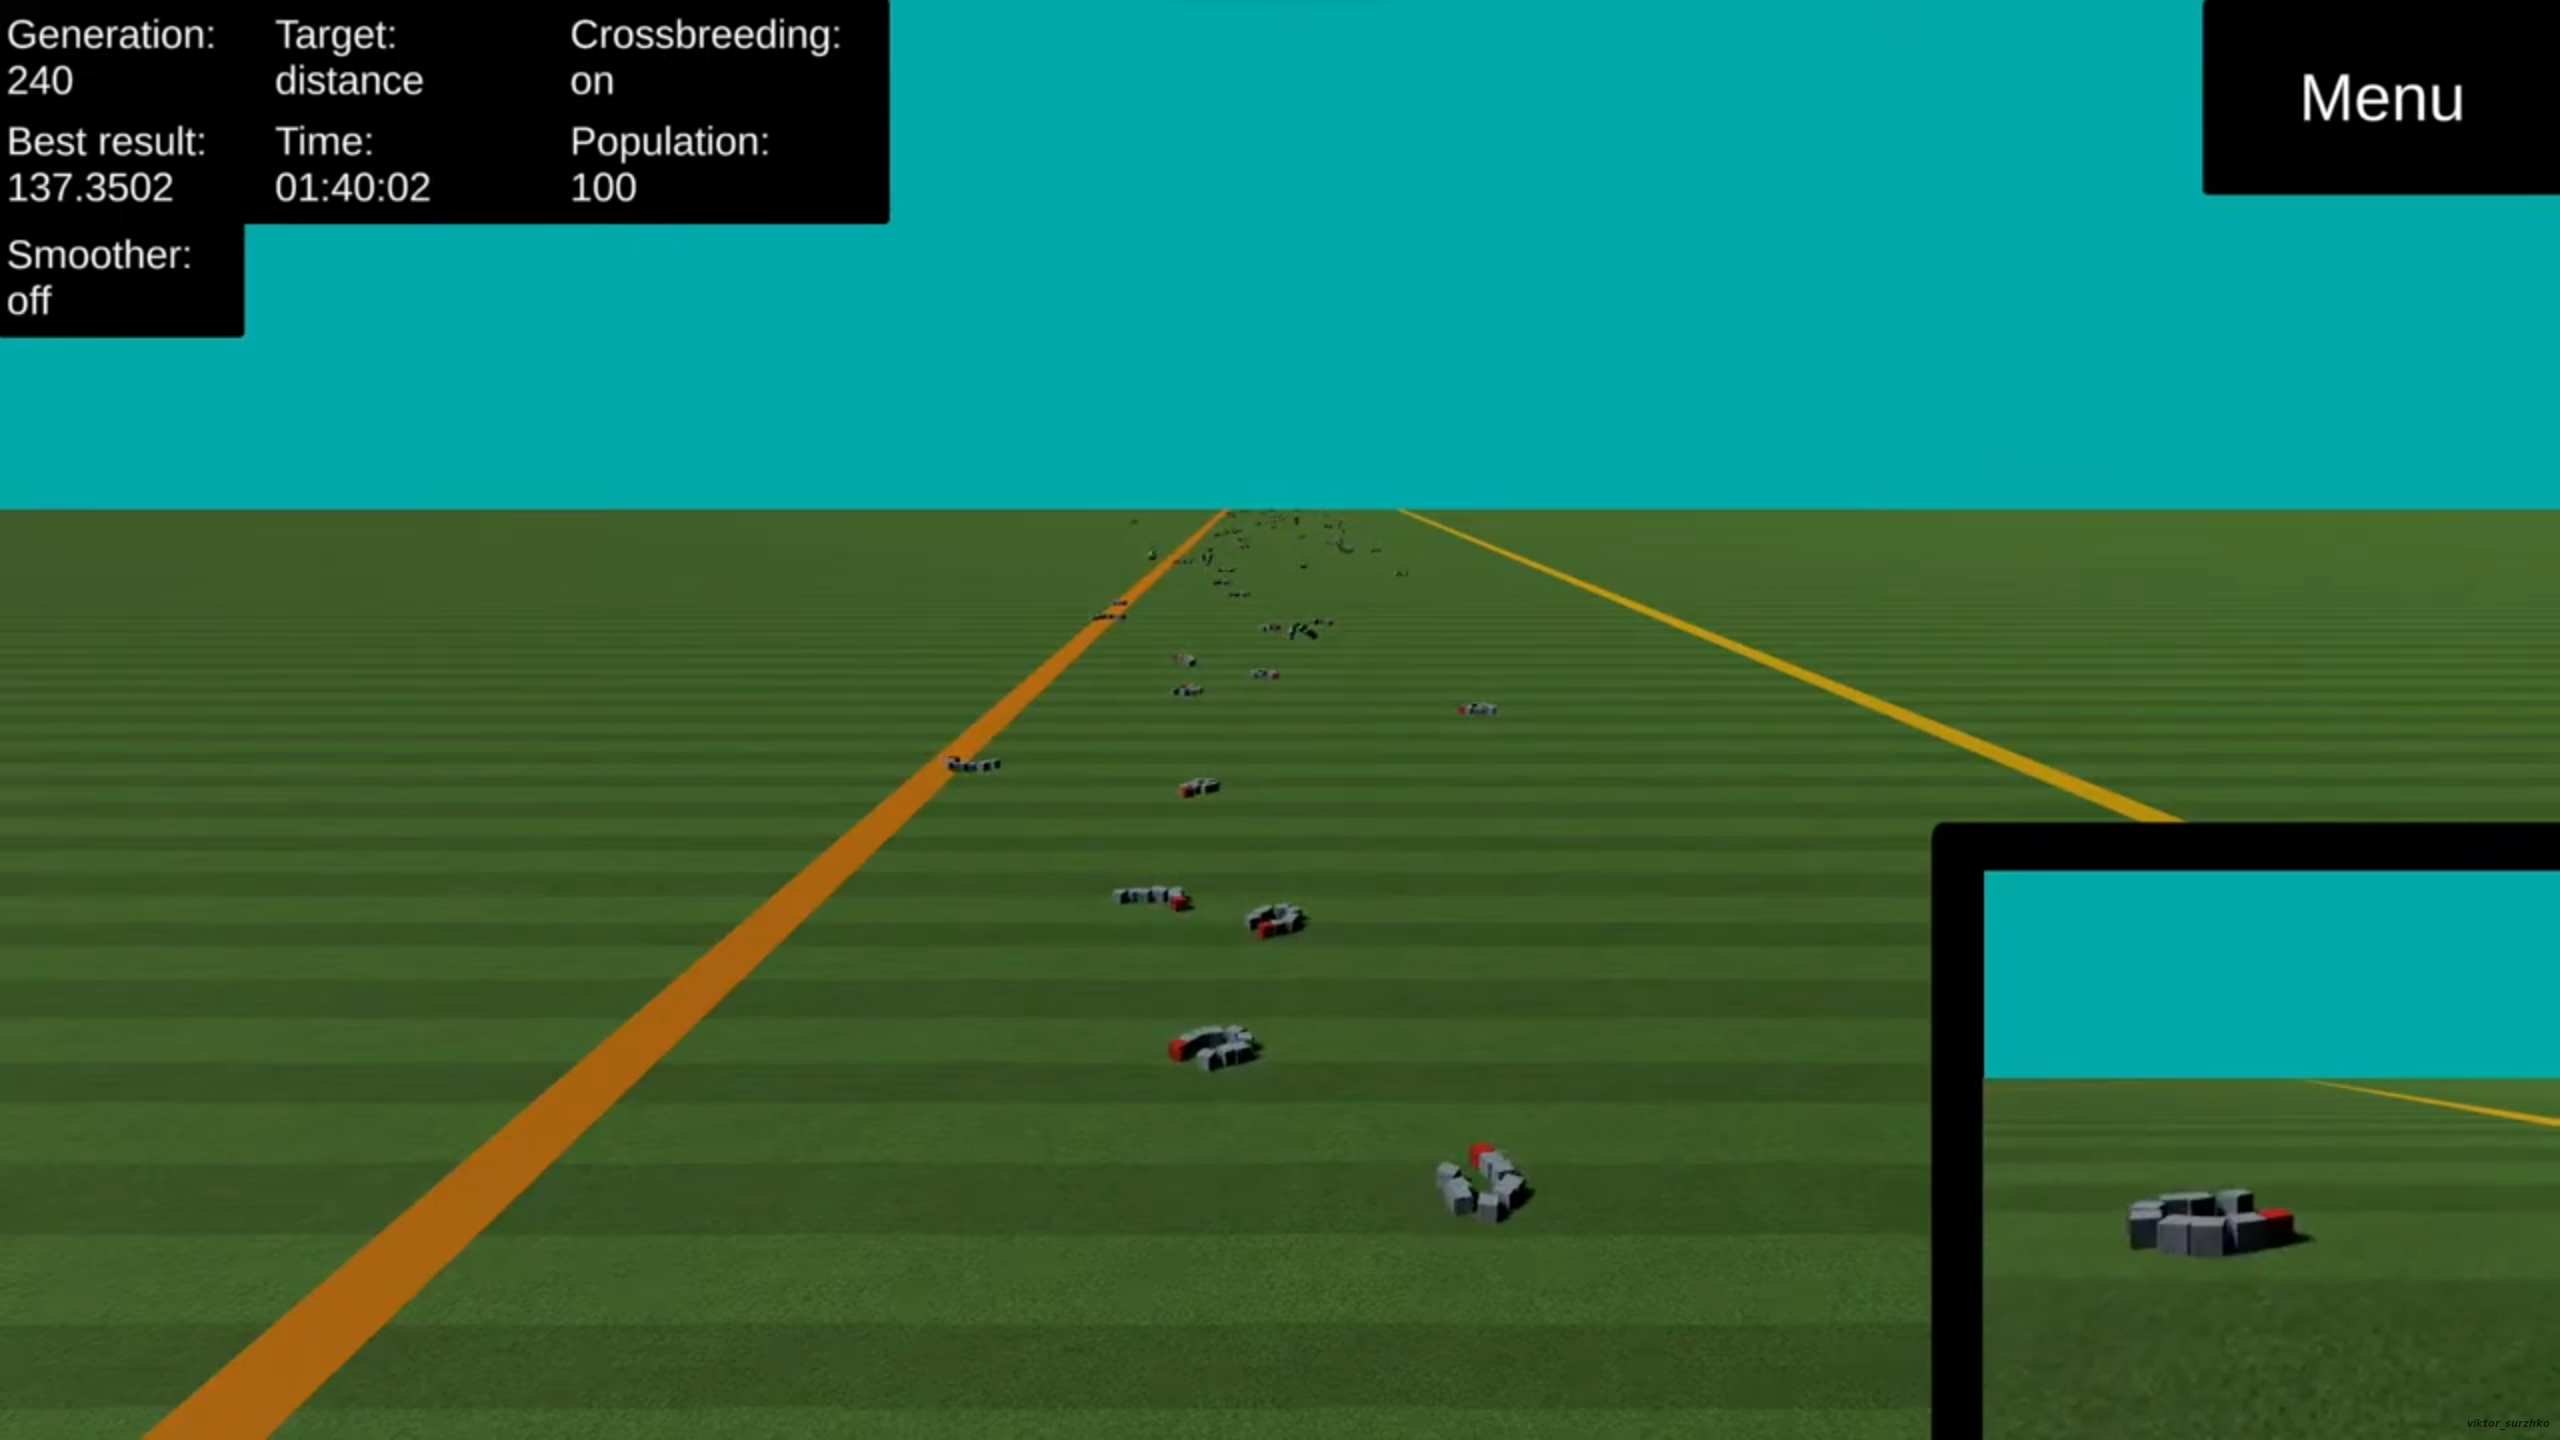 Figure 1: Screenshot from the app. Source: own work Neural networkThe neural network will directly depend on the number of segments in the creature. In my case, this is nine segments, so the model of the neural network will look as follows:
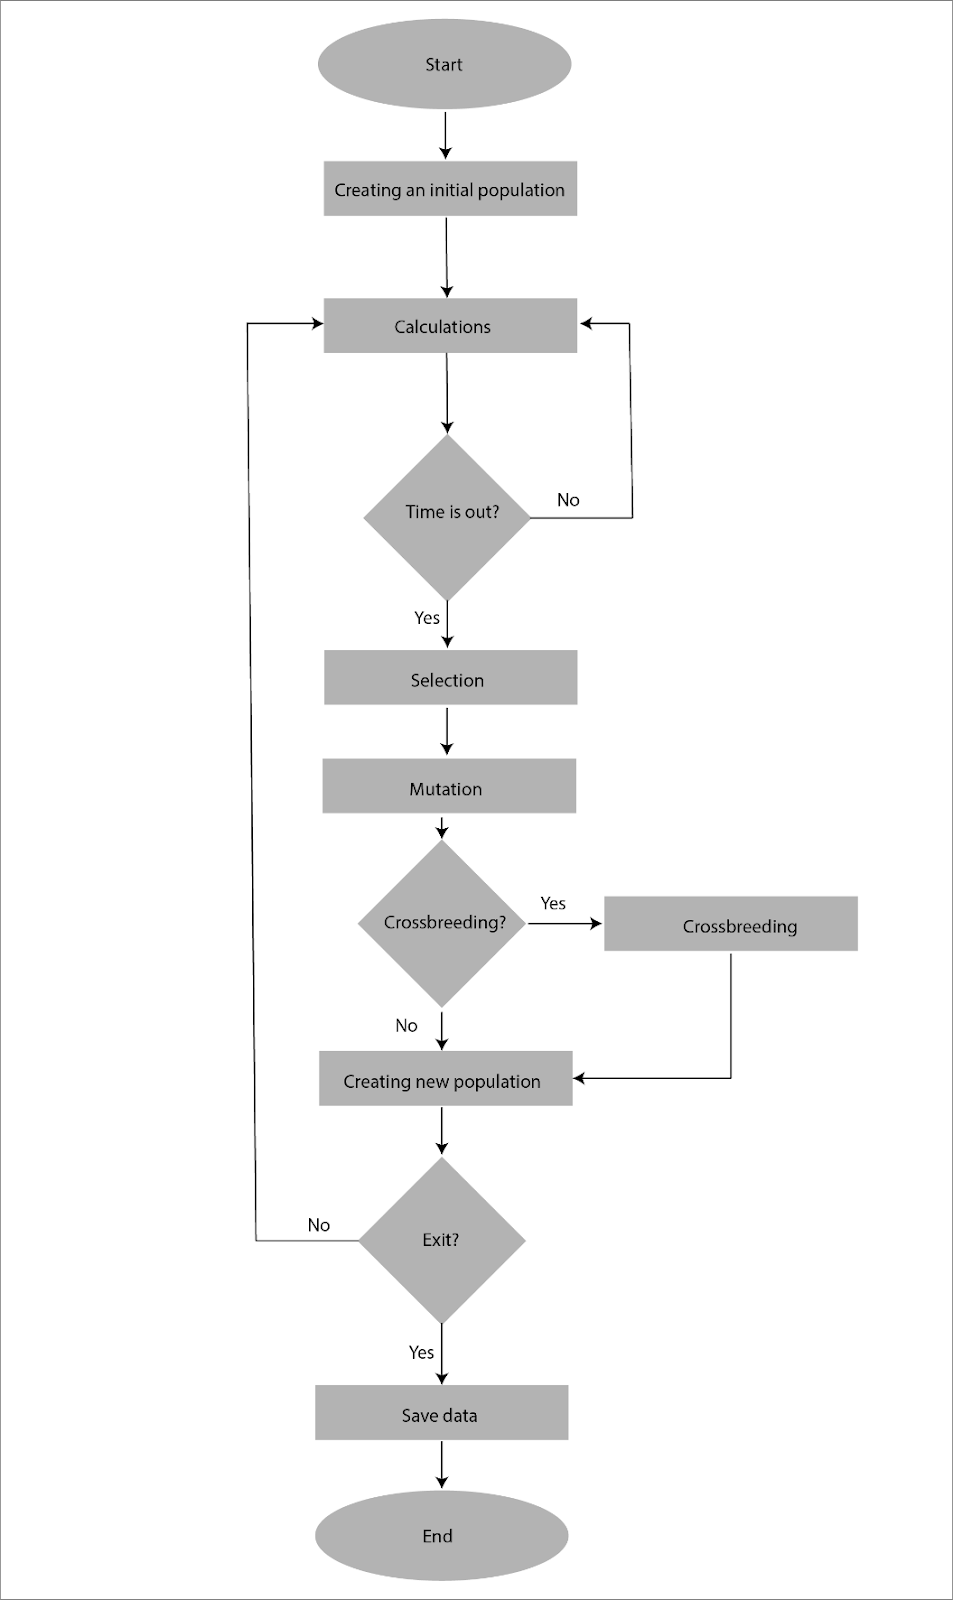
The neural network consists of 1 input layer, 2 hidden layers and 1 output layer. In theory, such a neural network model should be able to cope with the tasks. Genetic algorithmThe logic of the simulation is directly related to the genetic algorithm, which is why the general logic will look like this:
This is roughly how the genetic algorithm will be implemented to the general logic of the application.
SimulationsDistance: ANN_2021_01_23_22_29_02The simulation was run with the following parameters:
The simulation time was 1 hour, 41 minutes, 51 seconds. The number of generations was 407. The maximum distance covered was 121.0147 units, and the creature reached this mark in 159 generations. Video link 2: https://youtu.be/QtAkW6LK7Lw
Distance: ANN_2021_01_23_16_54_26The simulation was run with the following parameters:
The simulation time was 1 hour, 28 minutes, 22 seconds. The number of generations was 369. The maximum distance covered was 48.84888 units, and a creature reached this mark in 296 generations. Video link 3: https://youtu.be/xM_sAa_Sxxw
Distance: ANN_2021_01_24_22_45_08The simulation was run with the following parameters:
The simulation time was 1 hour, 21 minutes, 58 seconds. The number of generations was 326. The maximum distance covered was 42.90 units, which was reached by the creature in 289 generations. Video link 4: https://youtu.be/DblmzdYgiRI
Distance: ANN_2021_01_25_00_09_57 The simulation was run with the following parameters:
The simulation time was 9 hours, 07 minutes, 42 seconds. The number of generations was 1642. The maximum distance covered was 47.23065 units, and a creature reached this mark in 1614 generations. Video link 5: https://youtu.be/PSgpfKCQajc
Distance: ANN_2021_01_23_15_12_04 The simulation was run with the following parameters:
The simulation time was 1 hour, 41 minutes and 32 seconds. The number of generations was 405. The maximum distance covered was 114.4245 units, and the creature reached this mark in the 356th generation. Video link 6: https://youtu.be/X8Kc5G8W10o
Distance: ANN_2021_01_24_00_12_19The simulation was run with the following parameters:
The simulation time was 1 hour, 17 minutes, 46 seconds. The number of generations was 306. The maximum distance covered was 121.9741 units, which was reached by the creature in 272 generations. Video link 7: https://youtu.be/jLS6nzlTb_Q
Distance: ANN_2021_01_24_18_22_02The simulation was run with the following parameters:
The simulation time was 2 hours, 10 minutes, 56 seconds. The number of generations was 313. The maximum distance covered was 142.1166 units, which was reached by the creature in 242 generations. Video link 8: https://youtu.be/CIKyYza_fe8
Distance: ANN_2021_01_26_12_57_58The simulation was run with the following parameters:
The simulation time was 4 hours, 17 minutes, 28 seconds. The number of generations was 609. The maximum distance covered was 128.7373 units, which was reached by the creature in 353 generations. Video link 9: https://youtu.be/gOfZ55Is3Nk
Distance: ANN_2021_01_25_10_15_11The simulation was run with the following parameters:
The simulation time was 6 hours, 09 minutes, 57 seconds. The number of generations was 888. The maximum distance covered was 69.58593 units, which was reached by the creature in 838 generations. Video link 10: https://youtu.be/RyCJOHqpnrI
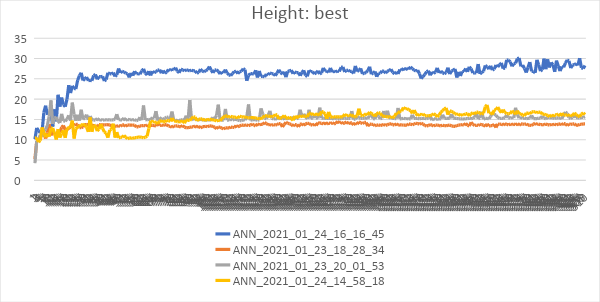
Height: ANN_2021_01_23_18_28_34The simulation was run with the following parameters: Population: 100
The simulation time was 1 hour, 32 minutes and 26 seconds. The number of generations was 368. The maximum height reached was 14.56771 units, and a creature reached this mark in 171 generations. Video link 11: https://youtu.be/giRKlhOcGyM
Height: ANN_2021_01_24_14_58_18The simulation was run with the following parameters:
The simulation time was 1 hour, 17 minutes, 48 seconds. The number of generations was 310. The maximum height reached was 18.57985 units, and a creature reached this mark in 261 generations. Video link 12: https://youtu.be/Xx1_zV5djUs
Height: ANN_2021_05_27_05_33_24The simulation was run with the following parameters:
The simulation time was 1 hour, 28 minutes, 45 seconds. The number of generations was 353. The maximum height reached was 16.25196 units, and a creature reached this mark at 230 generations. Video link 13: https://youtu.be/0FU0WhEI_P4
Height: ANN_2021_01_24_16_16_45The simulation was run with the following parameters:
The simulation time was 1 hour, 58 minutes, 04 seconds. The number of generations was 470. The maximum height reached was 30.55556 units, and a creature reached this mark in 362 generations. Video link 14: https://youtu.be/oPbtb4knl4c
Height: ANN_2021_01_23_20_01_53The simulation was run with the following parameters:
The simulation time was 1 hour, 37 minutes, 56 seconds. The number of generations was 390. The maximum height reached was 19.79545 units, and a creature reached this mark in 88 generations. Video link 15: https://youtu.be/RybjoJzSvDY
Height: ANN_2021_05_27_07_04_55The simulation was run with the following parameters:
The simulation time was 1 hour, 32 minutes, 04 seconds. The number of generations was 366. The maximum height reached was 18.75084 units, and a creature reached this mark in the 265th generation. Video link 16: https://youtu.be/iPNp1Ge-lAw
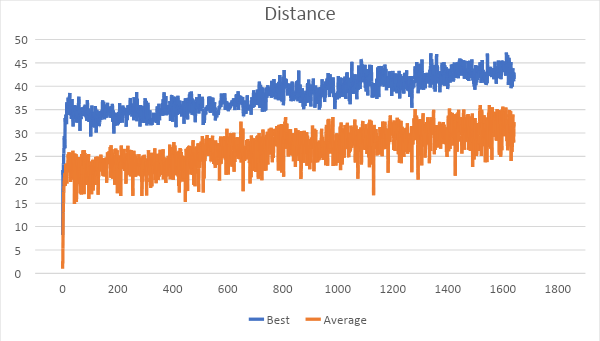
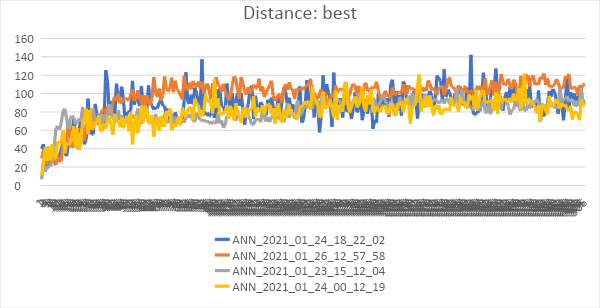
Simulation resultsSimulations were run with different parameters, such as population lifetime, simulation goal, with crossbreeding mechanics, without crossbreeding mechanics, with smoother and without smoother. The unchanged parameters were the number of creatures in the population, which was 100 creatures, and the mutation mechanics, since there is no provision to turn it off. Generation timeI analyzed the effect of the time allocated per generation. All 4 simulations have the same parameters except time. Crossbreeding and mutations are enabled, movement smoothing is disabled, and the goal is distance.
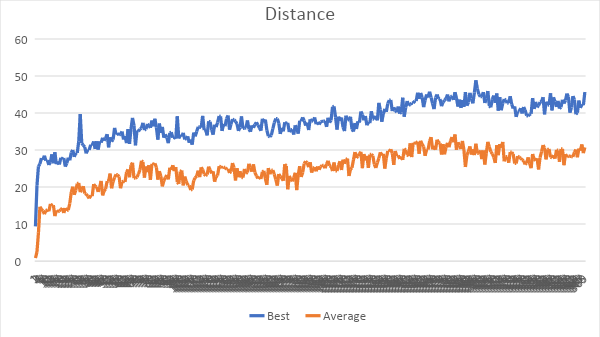
The time difference was only 10 seconds, and looking at the graph of the best results, you can see that there is no clear line. At some intervals, the best results overlap in all 4 simulations.
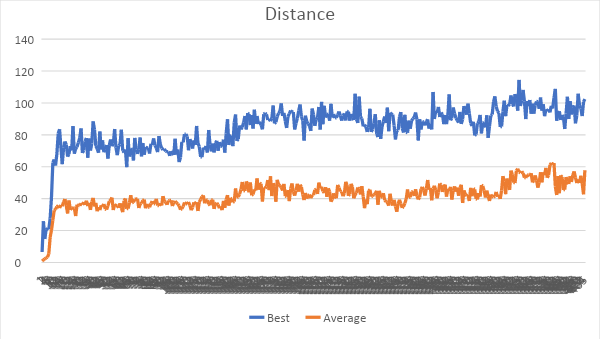
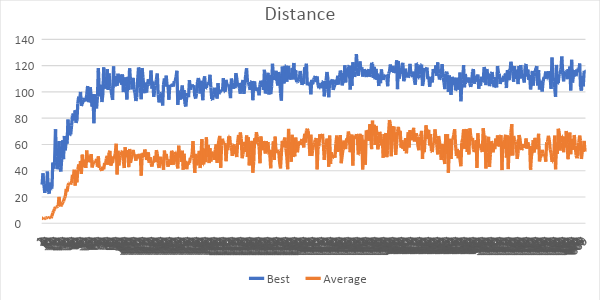
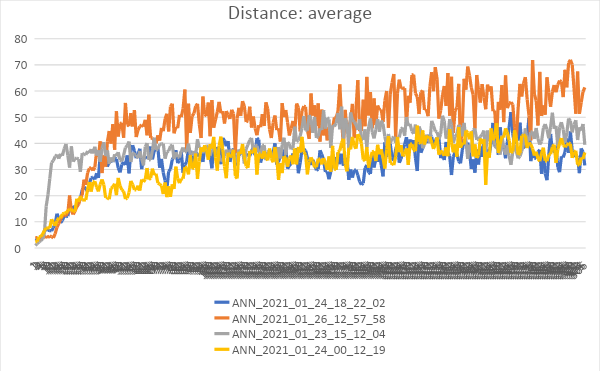
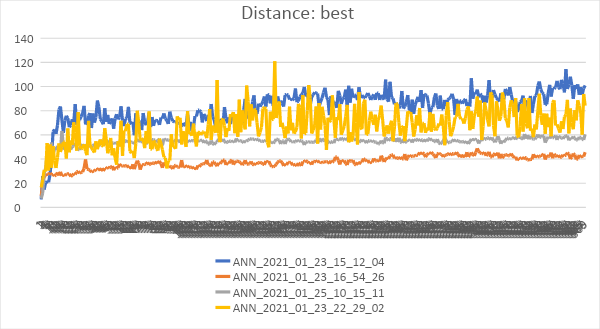
On the data graph with the average values, you can observe a clearer difference. The best result was obtained in the simulation number ANN_2021_01_26_12_57_58, but at the same time in one of the intervals the results were almost identical to the simulation number ANN_2021_01_23_15_12_04. Since the time allocated for generation in these two simulations was 10 seconds, I can assume that the difference in time is not significant to affect the final simulation results. The difference that can be observed rather depends on the movement pattern that the creatures acquired during evolution. DistanceSimulations in which the target was the maximum distance were run: with mutation only, with mutation and crossing, with mutation and smoother, and with all parameters simultaneously.
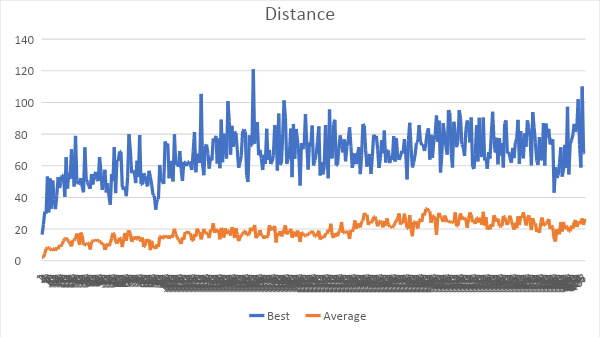
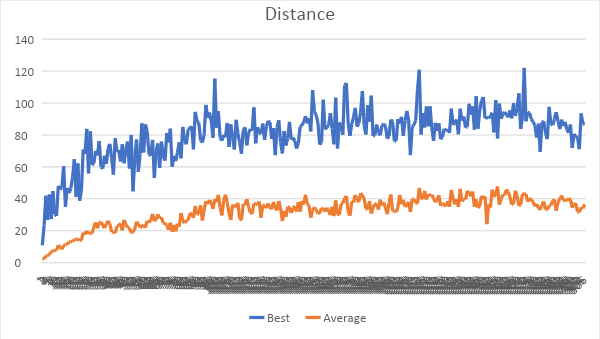
The best results clearly show the difference with certain parameters. The worst result was shown by the simulation only with smoother and mutations, but at the same time it showed almost stable results. The next bad simulation was with crossbreeding parameters, mutations and smoother, but in this case, we also managed to get very stable results. Next is a simulation in which there was only a mutation. The results were scattered, but at the same time managed to achieve the maximum result. In addition, in the last simulation, the mechanics of crossbreeding and mutation were included; looking at the best results, we can observe almost stable best results, although a few times another simulation managed to get a better result. I can confidently say that thanks to the smoother, you can get a more stable result, but at the same time not the best.
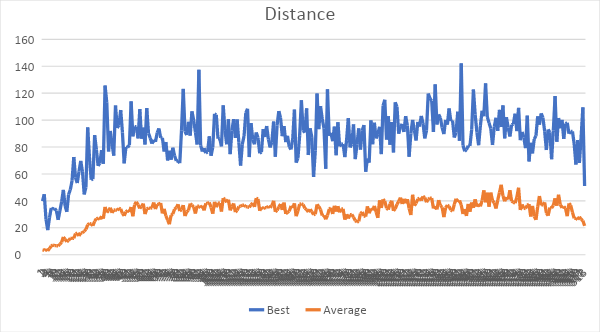
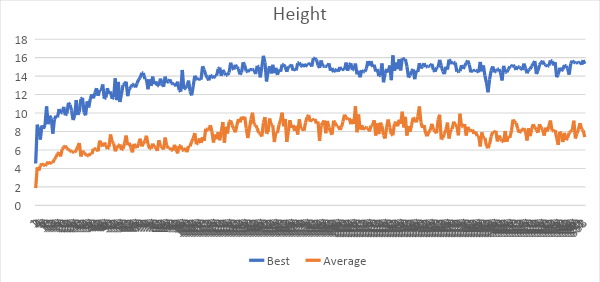
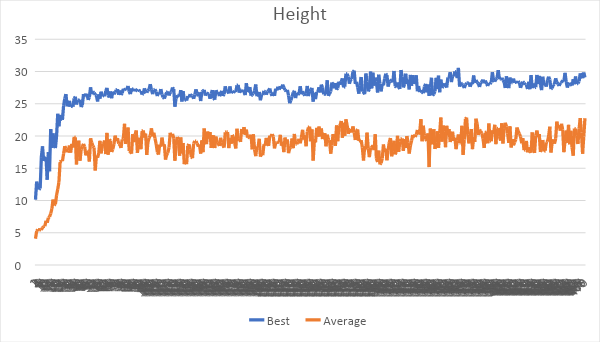
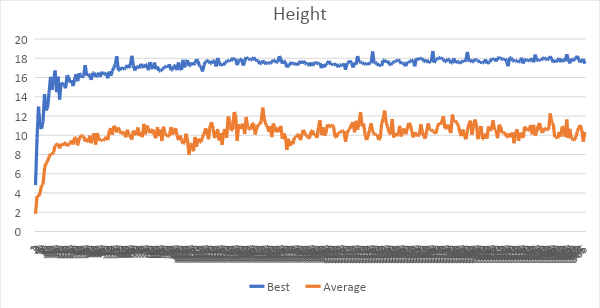
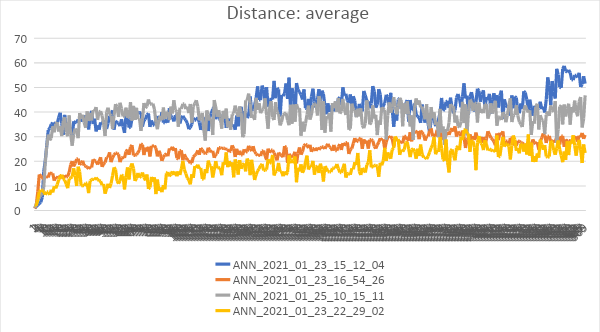
The average results show a noticeably larger difference than the best results. Simulations with crossbreeding mechanic show better results, while without crossbreeding it is not possible to get out of the local minimum. HeightWith height, we got more unambiguous results. The difference between the simulations was only in the parameters and as a result, we got the following.
It is immediately apparent that with the crossbreeding mechanics we were able to get a significant difference. In other cases, however, smoother stabilized the results, but at the same time did not allow the populations to evolve more actively. Simulation with mutation at some intervals was the worst, but after some time managed to be the best among other simulations, not counting only with crossbreeding
In terms of average results, the simulation with crossbreeding and mutations still shows the best result. It is followed by the simulation with mutations, crossbreeding and smoother, which managed to keep a stable and second best result. Finally yet importantly is the simulation with mutations and smoother and only with mutation. Based on the data, I can conclude that the simulation process works perfectly, and accomplishes all of its goals. Of course, in the future it will be possible to improve the conditions of the simulation, add the possibility of random events and other elements that will allow training creatures more effectively. | |
| Views: 1958 | |


| Total comments: 0 | |
